matplotlib设置y轴刻度范围【已解决】
matplotlib设置y轴刻度范围
·
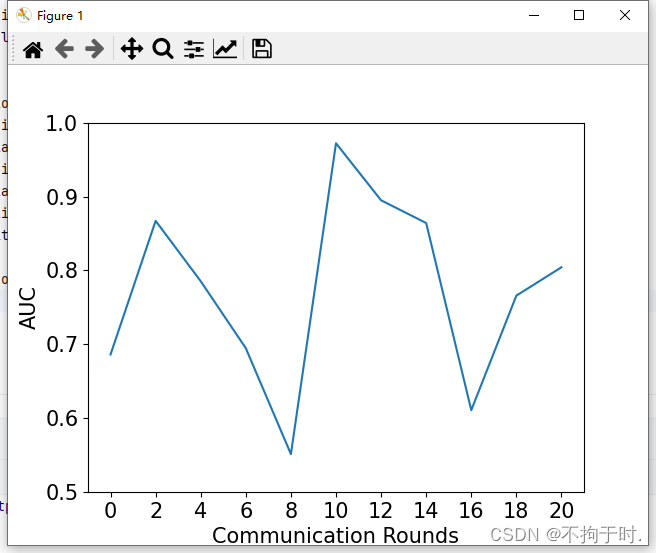
用matplotlib绘制个一个图,但是y轴刻度过大,因为AUC本身最大值是1,所以现在需要修改y轴刻度

上图的代码如下
import matplotlib.pyplot as plt
import numpy as np

# 假设你的数据范围是0.5到1
y_ticks_range = np.arange(0.5, 1.1, 0.1)

# 示例数据
communication_rounds = list(range(0, 21)[::2])
auc_values = np.random.uniform(0.5, 1, len(communication_rounds))

# 绘图
plt.plot(communication_rounds, auc_values)
plt.xticks(communication_rounds, fontsize=15)
plt.ylabel("AUC", fontsize=15)
plt.yticks(y_ticks_range, fontsize=15)
plt.xlabel("Communication Rounds", fontsize=15)
plt.title('(a)Breast Cancer', weight='bold', y=-0.5, fontsize=15)

plt.show()
只要限制一下范围就可以了,加入以下代码
plt.ylim(0.5, 1) # 设置 y 轴范围大功告成,y轴最大刻度已经变成了1

整体代码如下所示:
import matplotlib.pyplot as plt
import numpy as np

# 假设你的数据范围是0.5到1
y_ticks_range = np.arange(0.5, 1.1, 0.1)

# 示例数据
communication_rounds = list(range(0, 21)[::2])
auc_values = np.random.uniform(0.5, 1, len(communication_rounds))

# 绘图
plt.plot(communication_rounds, auc_values)
plt.xticks(communication_rounds, fontsize=15)
plt.ylabel("AUC", fontsize=15)
plt.yticks(y_ticks_range, fontsize=15)
plt.xlabel("Communication Rounds", fontsize=15)
plt.ylim(0.5, 1)  # 设置 y 轴范围
plt.title('(a)Breast Cancer', weight='bold', y=-0.5, fontsize=15)

plt.show()
更多推荐
 已为社区贡献2条内容


所有评论(0)